China Radio & TV Network Co., Ltd., together with Beijing Medialand Media Communication Strategy Consulting Co., Ltd. (CMMR), jointly released the 2017 domestic household viewing market household survey.
The survey was conducted from July to August 2017. The survey covered the 12-74-year-old resident TV population of 30 provinces/municipalities (neutral in Tibet, Hong Kong, Macao and Taiwan regions); Stage unequal probability sampling method, the number of sampling points was 587 in 2017, and 20737 valid questionnaires were obtained.
In 2017, the national television population base was 1.318 billion people and 364 million households.
I. The overall viewing pattern of Chinese families
1. Cable digital TV still dominates, but its share continues to decline, and new types of communication channels such as IPTV continue to grow rapidly
In 2017, cable digital television still dominated China's television coverage and communication channels. The largest user size accounted for 58.8%. Followed by live satellite digital TV and IPTV, the market share of ratings reached 15.2% and 14.4%, respectively, ranking the second and third in the household viewing market in China.
Since reaching the high point of user scale in 2015, the proportion of cable digital TV users has declined for two consecutive years, and fell below 60% for the first time in 2017. The development of direct-to-satellite digital television has been relatively stable. The proportion of users in the past five years has remained at between 13% and 17%.
In contrast, the scale of new-type coverage transmission users is steadily and rapidly increasing. Among them, the IPTV service launched by telecom operators showed a clear upward trend. In 2017, the country’s IPTV subscribers increased by 48.9% year-on-year, and the percentage of subscribers increased to 14.4%, making it the third largest television program signal transmission channel, and direct-to-satellite digital television. The gap in user size has further narrowed; OTT TVs with Internet genes have also developed rapidly. In 2017, the number of OTT TV users nationwide has grown rapidly, with an annual growth rate of 482.0%.
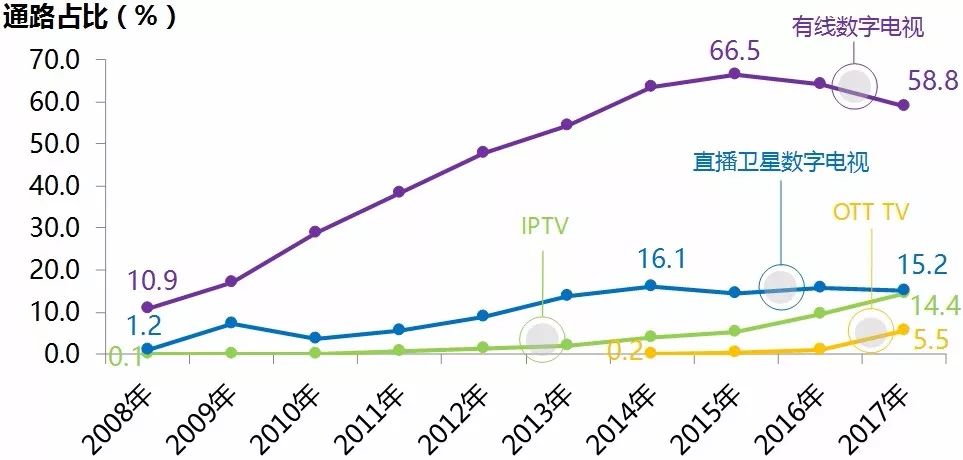
Figure 1 Development Status of Major Types of TV Communication Channels in the Country, 2008-2017 (%)
At the same time, the proportion of terrestrial digital TV users in 2017 is only 1.5%, provincial and municipal level cable TV public network (analog network), district/family homes/units of wired LAN, self-contained indoor (outside) antennas, self-provided The proportion of satellite receiving antenna users has also continued to shrink. In 2017, the total proportion accounted for less than 5%.
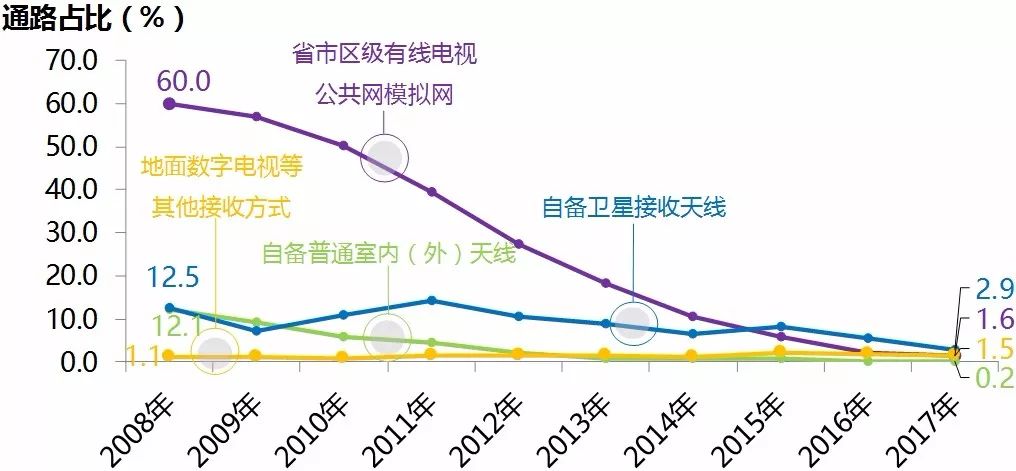
Figure 2 Development status of other types of television channels in the country from 2008 to 2017 (%)
(Note: In 2017, the number of wired LANs in the community/home institution/unit in the television communication channel accounts for less than 0.1% of the country, so it is omitted in the figure)
2. The coverage of cable digital TV and satellites in urban and rural areas is different, and the development of IPTV and OTT TV in urban and rural areas is balanced.
The coverage of cable digital TV in rural and urban areas is generally high, but the coverage in rural areas is significantly lower than in urban areas. Since 2015, the coverage of digital cable television has declined in different degrees both in urban and rural areas. Among them, the coverage of digital cable television in urban areas has decreased by a large margin, reaching 7.8 percentage points year-on-year.
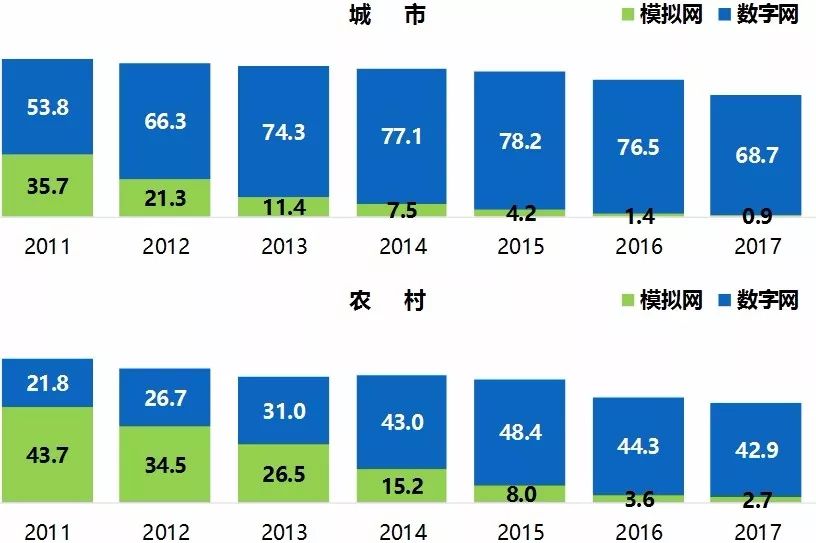
Figure 3 Percentage of users of cable TV public network in urban and rural areas, 2011-2017 (%)
In rural areas, satellites are still the most important way for viewers to watch other than digital cable television. In 2017, the proportion of users who used live satellite digital television and self-prepared satellite receiving antennas to watch TV in rural areas was 27.9% and 5.8%, respectively, and the combined viewing share of the two was over one-third.
Relatively speaking, IPTV and OTT TV users are more evenly distributed in urban and rural areas. In 2017, in the urban areas, the proportions of users of IPTV and OTT TV were 15.6% and 5.8%, respectively, and the proportion of users in both rural areas reached 12.4% and 5.1%.
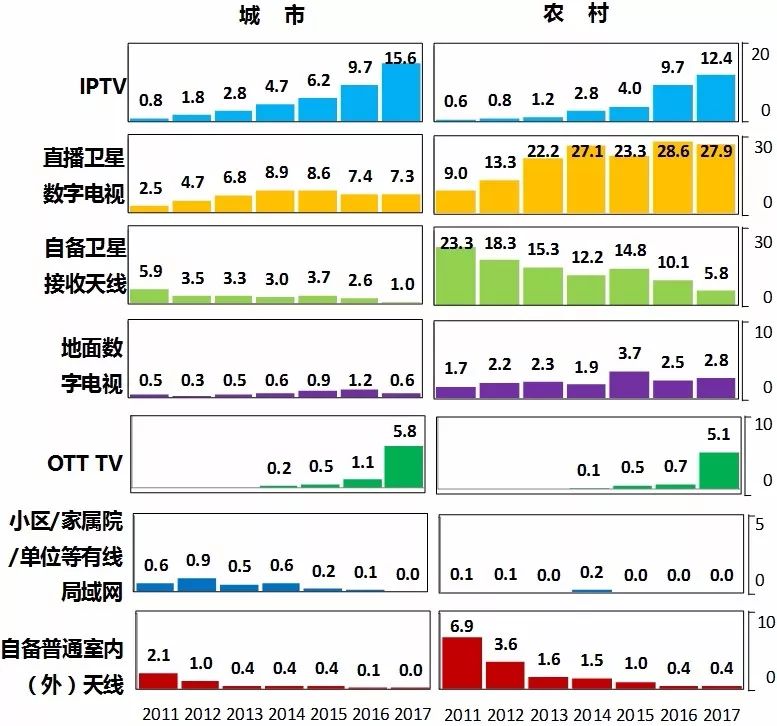
Figure 4 Ratio of non-cable receiving users in urban and rural areas, 2011-2017 (%)
3. The distribution of cable TV users varies greatly, and the market share of cable TV users in the middle and western provinces is relatively low
According to the results of the household survey, the coverage of cable TV networks in different provinces across the country is quite different. In most of the eastern provinces of China such as Beijing, Guangdong, and Zhejiang, the coverage of cable TV public network users has reached over 80%; while in Hebei Province, Anhui Province, and most of the western provinces, the composition of television coverage channels is relatively complex, and non-cable television networks Occupy a larger market share, cable TV network coverage rate of less than 40%.
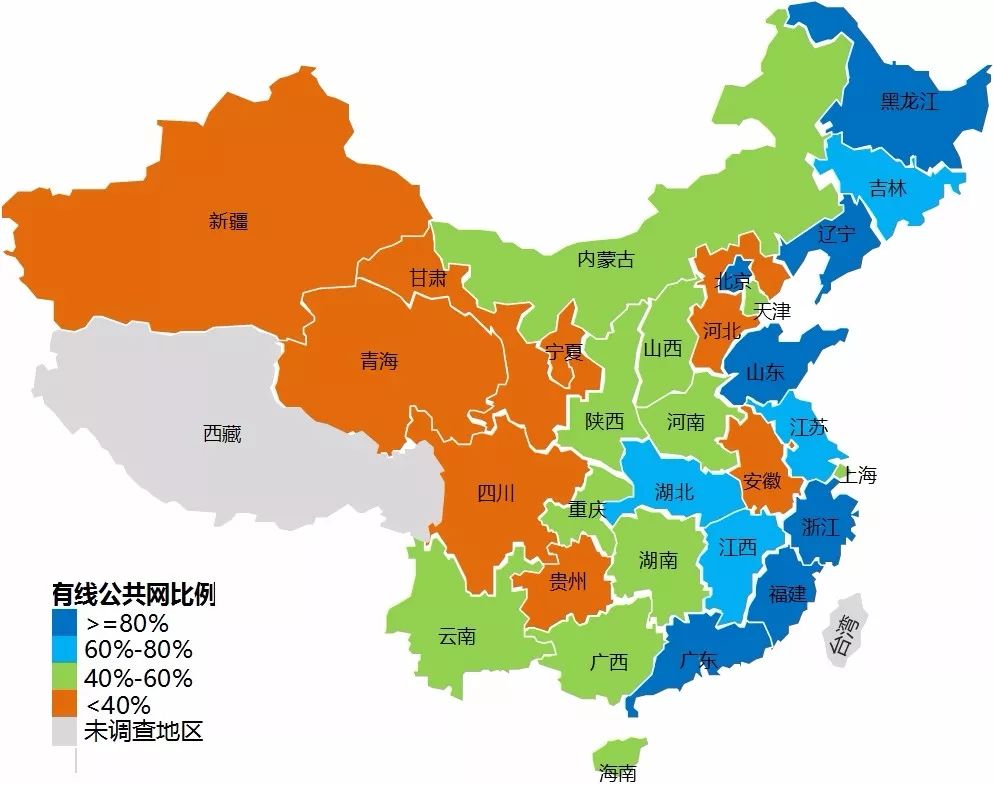
Figure 5: Map of the National TV Population by Province Wire Network in 2017
4. "One-family and multiple-terminal" has gradually become a new trend of development, with over three-tenths of users choosing to use the combination of IPTV and cable digital TV at the same time.
With the rapid development of a variety of new types of transmission paths, users of television programs using two or more receiving methods in the television population of the country have shown an increasing trend year by year. From a geographical point of view, the proportion of users of “one household and multiple terminals†in Zhejiang Province ranks first in the country, followed by Jiangsu Province and Jiangxi Province. The proportion of “one household with multiple terminals†users in five provinces including Henan, Chongqing, Hubei, Hunan and Guizhou is in the second echelon.
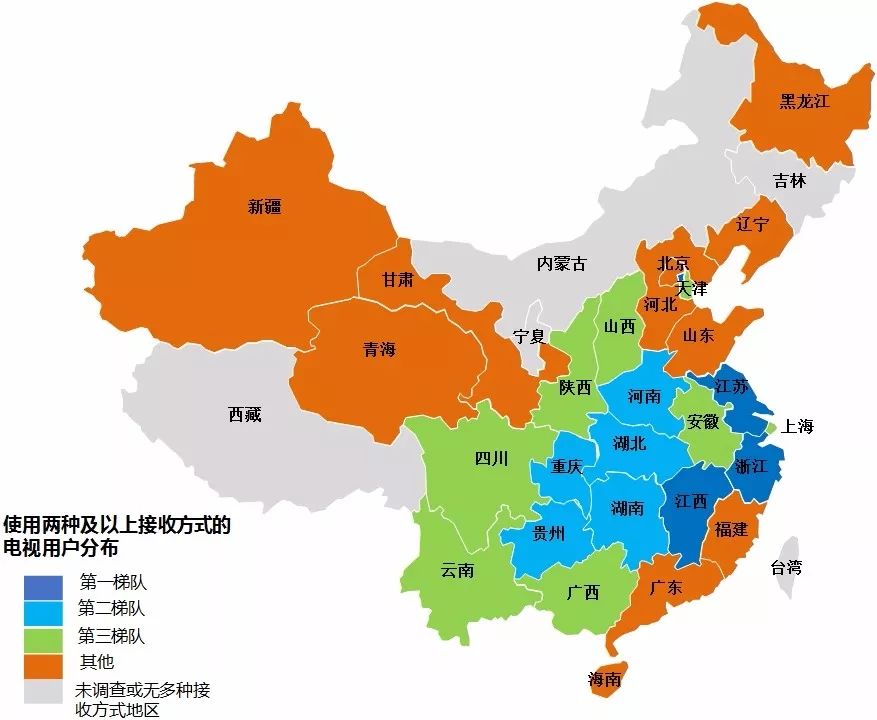
Figure 6 Distribution of users who watch TV programs using two or more receiving modes in 2017
(Note: Some provinces (municipalities, districts) do not use a variety of receivers to receive TV signals, so they are omitted.)
In the terminal selection of “one-to-many-multi-terminal†users, it can be seen from the top ten multiple terminal combinations that more than 30% of users use IPTV and cable digital TV at the same time, followed by the combination of cable digital TV and OTT TV. , accounting for 24.0%; select cable digital TV with live satellite digital TV users accounted for 16.6%, and IPTV and direct-to-satellite digital TV combination of these two receiving methods are also favored by nearly 10% of users. It can be seen that the users of cable digital TV, IPTV, and direct broadcast satellite users have a great overlap, and they can complement each other to a certain extent.

Figure 7 Combination of Multiple Receiving Methods in 2017 (TOP10)
5. The industrial concentration of OTT TV gradually increases, and the industrial ecology gradually forms
In 2017, the competition between OTT TV's integrated broadcast control licensees has become increasingly fierce. The market share of licensees such as China TV, Mango TV and BesTV exceeded 20%, and CIBN (Guangdong) accounted for 15.4%. China TV, Mango TV, BesTV and CIBN have formed the first camp. Rich resources and good user experience are the key to snatch users and improve stickiness.
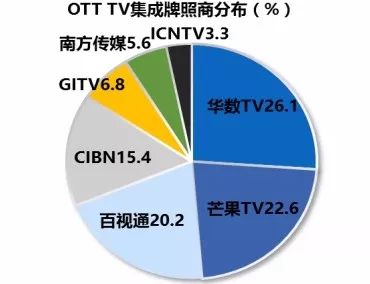
Figure 8 Distribution of OTT TV Integrated Broadcasting Licensing Vendors in 2017 (%)
From the on-demand software installed by the OTT TV users in China through the Internet TV integrated broadcast control platform in 2017, users generally prefer to use on-demand software with content resources. Among the top five on-demand software with content resources, the proportion of on-demand software users of iQIYI, Tencent Video, Mango TV, Youku and other mainstream video service providers exceeded 10%. On the one hand, under the guidance of the relevant policies and regulations of the General Administration of Administration in recent years, more and more mainstream video sites have increased their cooperation with licensees for broadcasting and television integration and television broadcasting, and have become legitimate “regular forces†on television screens. The supply of Internet TV program content; on the other hand, the mainstream video websites have also increased the self-control of the program content on the basis of accumulated a large number of high-quality copyrighted programs, and created a series of explosive TV dramas and variety shows with good market response. Therefore, it meets the on-demand demand of viewing viewers. In the third-party on-demand software that aggregates all content, TV cats accounted for 9.7% of users, and the remaining on-demand software accounted for no more than 5%.

Figure 9 On-demand software distribution of OTT TV users nationwide in 2017 (%)
Second, China's family ratings
1. The overall satisfaction rate of viewing subscribers is relatively high, but the satisfaction rate of cable digital TV and IPTV users has declined compared to the same period of last year, and the OTT TV satisfaction rate has slightly improved.
The survey showed that most of the users in 2017 were satisfied with the services of cable digital TV, IPTV and OTT TV, and the satisfaction rate exceeded 80%. The IPTV satisfaction rate was the highest, reaching 86.9%. With the diversification and rapid development of television coverage transmission channels, users have more choices, and a good user experience and low tariff standards are becoming increasingly important, which directly determines the degree of user satisfaction.
Compared with the same period of last year, the overall satisfaction rate of cable digital TV and IPTV subscribers declined in 2017, dropping by 3.9 and 3.1 percentage points respectively. The reason is that the number of programs, tariff issues and other factors have become the main reason for the decline in the satisfaction rate of digital cable TV. However, the operation is complicated and the slow speed is the biggest reason for the decline in IPTV satisfaction rate. Cable digital TV and IPTV should be more content than content. Pay attention to tariff levels and improve its own service level; OTT TV has improved user stickiness due to delays in live broadcasting, improvements in box crashes, and diversified value-added services. Its user satisfaction rate has increased by 2% compared to last year. Can be.
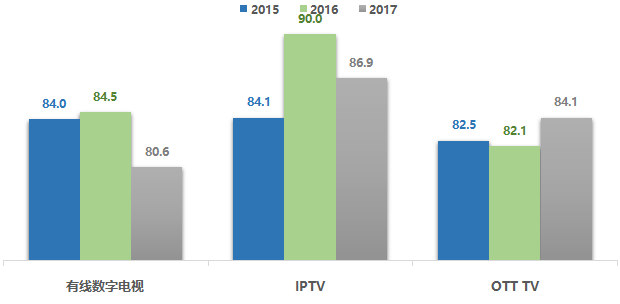
Figure 10 Customer Satisfaction Rate of Cable Digital TV, IPTV and OTT TV in 2017 (%)
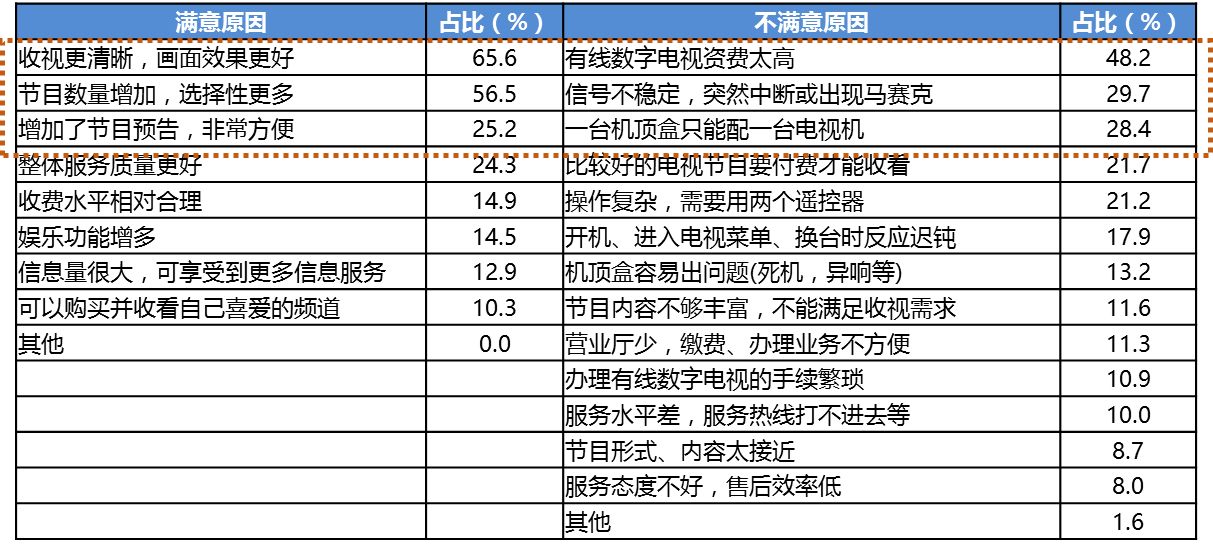
2. The cable digital TV users are satisfied with the rich content of the program and the clearness of the viewing screen. Too high fees are the primary reason for the user's satisfaction rate.
The following table shows the reasons for cable TV users' satisfaction and dissatisfaction. Among them, the top three reasons for the satisfaction of cable digital TV users are "more clear-cut viewing, better picture quality," "increased number of programs, more selectiveness," and "increased program preview, very convenient," over 50%. The users expressed satisfaction with the first two items. This is the main reason that cable TV attracts users. The top three reasons for being unsatisfied are: “The price of cable digital TV is too high†and “The signal is unstable, suddenly interrupted or appears mosaicâ€. And "a set-top box can only be equipped with a TV", which "too high tariffs" is still the core reason for cable TV users are not satisfied, accounting for 48.2%.
Table 1 Reasons for Satisfaction and Dissatisfaction of Cable Digital TV Users in China (%)
Compared with 2016, cable digital TV users have the highest satisfaction rate for “rich programming content and satisfied viewership demandsâ€, which is 5.3 percentage points higher. In addition, the “overall service quality†and “rationality of fees and charges†have also been more users. Accredited. Although the user's satisfaction rate for “increased number of programs and more selectivity†was higher, it was the largest decline compared with the same period of last year, indicating that users considered that while the quality of television programs was improving, the number of programs failed to increase simultaneously and the selectivity was still insufficient. In addition, "a set-top box can only be equipped with a TV" restricts the user's use, the satisfaction rate decreases, and the user's demand for intelligent, cross-screen and cross-terminal home viewing experience tends to be obvious.
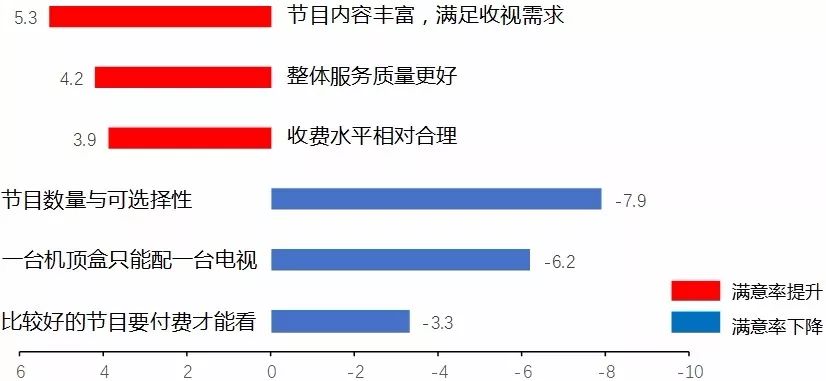
Figure 11. Changes in the year-on-year satisfaction rate of cable digital TV users
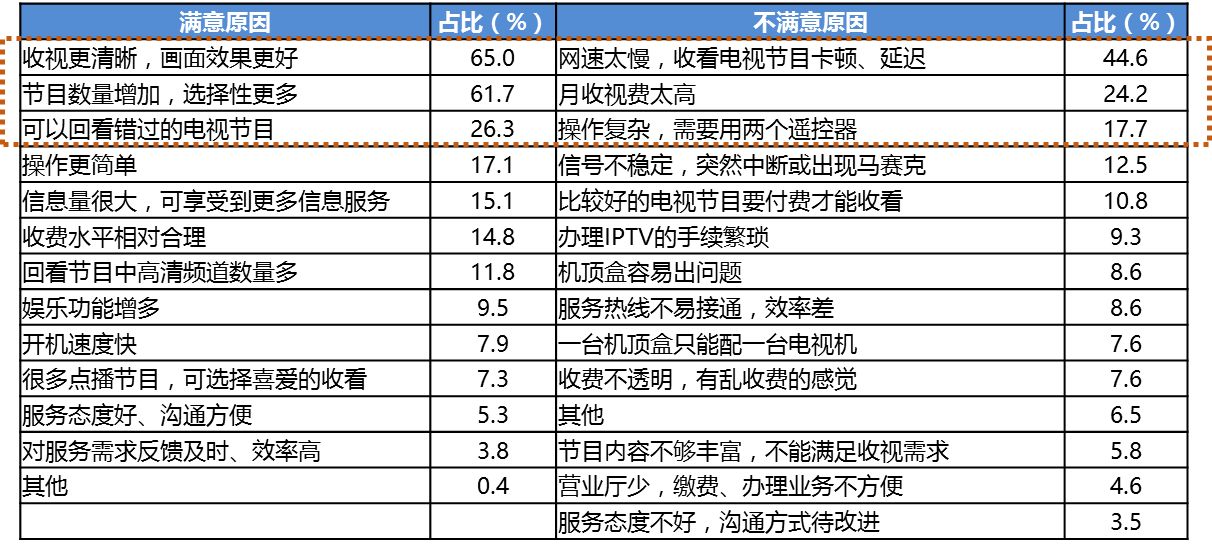
The following table shows the reasons for IPTV users' satisfaction and dissatisfaction. Among them, the top three reasons for the satisfaction of IPTV subscribers are "more clear-cut viewing, better picture quality," "increased number of programs, more selectiveness," and "can look back at missed TV programs." Better picture quality "The increase in the number of programs and more selectivity" is the main reason for user satisfaction. The percentage of satisfied users is higher than 60%; the top three reasons for dissatisfaction are: "The speed is too slow and TV programs are being watched. "Don't delay," "The monthly subscription fee is too high," and "The operation is complicated, and two remote controls are needed." Among them, "the speed of the Internet is too slow, watching TV programs and delays" is the core reason why IPTV users are not satisfied. Bida 44.6%.
Table 2 Reasons for National IPTV User Satisfaction and Dissatisfaction in 2017 (%)
Compared with the same period of last year, in the context of the rapid progress of “acceleration and fee reduction†measures in 2017, IPTV users’ satisfaction rate for “relatively reasonable fees†has increased by 24.6 percentage points, which is a significant increase. In addition, IPTV users also think that IPTV has a problem of rich program content and insufficient number of programs. At the same time, users think that “the operation is complicated and requires two remote controllers†and “the speed of the network is too slow, watching television programs are stalled, delays†and other issues affect the User experience, the satisfaction rate dropped more.
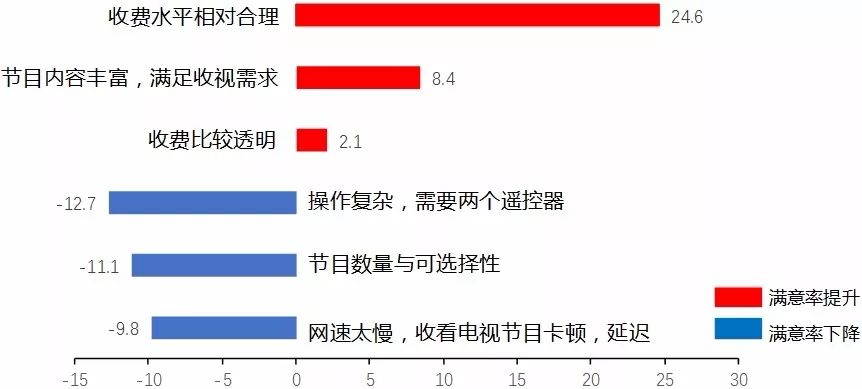
Figure 12 Change in IPTV user satisfaction rate over the same period
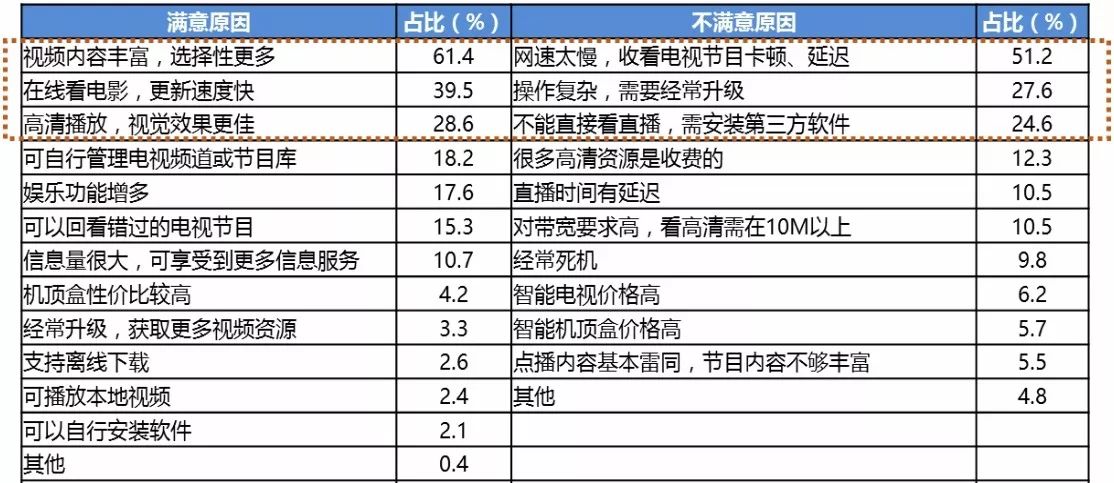
The following table shows the reasons why OTT TV users are satisfied and dissatisfied. Among them, the top three reasons for OTT TV user satisfaction are "rich video content and more selective" "online movie watching, fast update" and "high-definition playback, better visual effects", and "rich video content , Selective more "is the core factor of OTT TV customer satisfaction, accounting for 61.4%; dissatisfaction reasons are the top three are "the speed is too slow, watching TV programs, delay," and "complicated operation, need Regular upgrades and “can't directly watch live broadcastsâ€, in which “the network is too slow, watching TV programs and delays†is still the main reason for user dissatisfaction, accounting for 51.2%.
Table 3 Reasons for OTT TV Customer Satisfaction and Dissatisfaction in 2017 (%)
Compared with the same period of last year, the overall satisfaction rate of OTT TV users has increased compared to last year. The "live delay" and "frequent deadlock" phenomena have become the most important reasons for the increase in satisfaction rate. The reason is that OTT TV service providers have accumulated rich experiences in the construction of their own live broadcast platforms or direct purchase of popular sports events, TV dramas, and premiere rights under the rush of concepts such as the Internet "live first year" and "IP copyright". The operating experience, in addition to starting to provide users with high-quality content outside the live channel, has improved the past users of OTT TV "live broadcast delay" in the criticism. In addition, with the development of hardware and software technologies, OTT TV box products have been continuously improved, performance has been continuously optimized, and the occurrence of “frequent deadlocks†has also been reduced. As a result, user satisfaction rates have also increased significantly. At the same time, issues such as “complicated operations, frequent upgrades,†“cannot directly look at live broadcasts, and need to install third-party software†are also the main reasons that currently affect OTT TV user satisfaction.
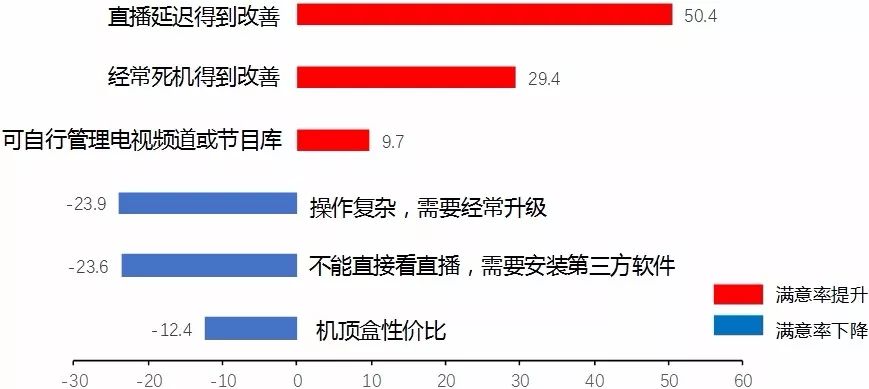
Figure 13 Change in OTT TV user satisfaction rate over the same period
Overall, cable digital TV and IPTV show high satisfaction rates for the viewing results. OTT TV users are more satisfied with the massive amount of program content they provide. In terms of dissatisfaction, cable TV charges are too high. The signal transmission quality of IPTV and OTT TV is still the core factor of users' dissatisfaction, and OTT TV has greatly improved the user's bad experience of “live-streaming delay†by increasing the investment of proprietary copyrighted content. Therefore, OTT TV 2017 OTT TV's user satisfaction rate has increased significantly compared with competitors. For CATV network operators, in the current rapid development of various types of transmission channels, it is necessary to further supplement short boards and enhance their competitiveness in response to user needs. Therefore, on the basis of ensuring high-quality viewing quality, further enriching the broadcast content of programs, lowering basic viewing fees, and optimizing user experience are key issues that will be resolved in the future.
Third, Chinese family viewing preferences
1, TV live is still the first demand, especially for cable digital TV users
From the perspective of the number of regular use of functions by cable digital TV, IPTV, and OTT TV users in 2017, cable digital TV, IPTV, and OTT TV users all watch TV live broadcasts. This is especially true for cable digital TV users. IPTV and OTT TV users have a relatively high percentage of value-added services.
Table 4 Regular use of features and willingness to pay for cable TV, IPTV, and OTT TV users nationwide in 2017 (%)
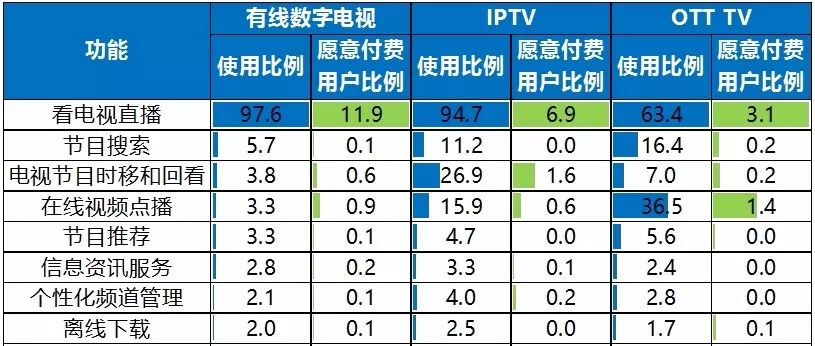
Specifically, "watching TV" is still the user's first request. The use of cable TV digital TV users to "watch live TV" is as high as 97.6%, slightly higher than 94.7% of IPTV, which is significantly higher than the 63.4% of OTT TV. " "Program search", "TV program time shift and look back", "online video on demand", "program recommendation" and other functions have gradually begun to have a certain user base. IPTV and OTT TV have higher flexibility in the content and function setting of on-demand programs than cable digital TVs. Therefore, the user selects the proportion of functions such as "time-shift and look-back of TV programs" and "online video-on-demand". Both are significantly higher than cable digital TV users.
At the same time, from the perspective of users’ willingness to pay, cable digital TV users’ willingness to pay is generally higher than the other two viewing modes. From the perspective of specific paid content, cable digital TV, IPTV, and OTT TV users have the highest percentage of willingness to pay for “watching live TVâ€. IPTV users have the most “time-shifted and watched TV programs†and OTT TV users have “onlineâ€. Video on Demand also has a high willingness to pay.
2. The audience’s favorite programs are still mainly entertainment programs, and they prefer to watch news programs on the big screen of TV.
Comparing the types of TV programs enjoyed by TV viewers and online video users in 2017, it is known that TV programs have again become a favorite of the two largest user groups with high popularity. News, commentary, entertainment, and movie categories all rushed into the top four. . Among them, viewers prefer to watch news/reviewing programs on TV screens. The rate of favor is 62.8%, compared with 30.7% for online video users. This shows that TV screens have more news and information. High authority and credibility, and its timeliness are stronger; and online video users are more fond of entertainment entertainment, movie programs, love rates were 46.4%, 36.7%, showing a clear pan-entertainment consumer preferences.
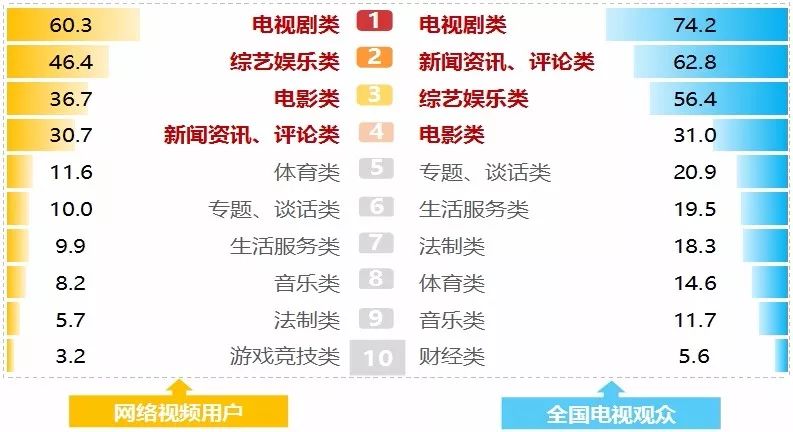
Figure 14 Types of favorite TV programs for TV viewers and online video users in 2017 Top10
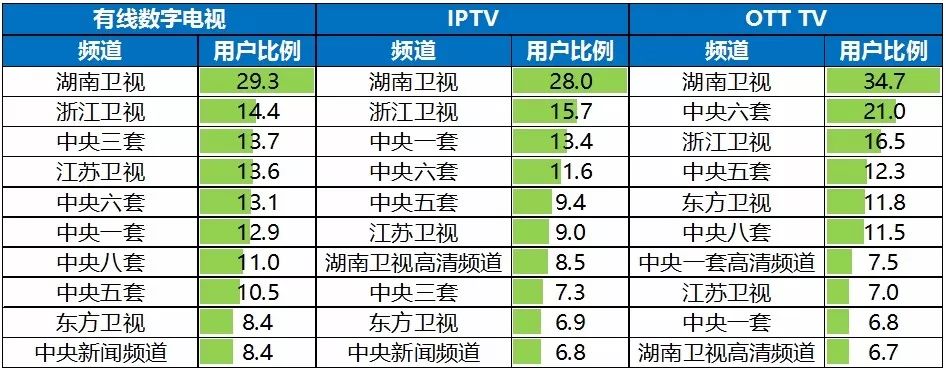
3, CCTV playback channel is generally welcomed, Hunan Satellite TV ranks first
The playback time-shift function is one of the most frequently used functions of Chinese home users except for watching live TV programs. It also has a high willingness to pay. In the content of programs that users often replay, the most important is still the central video channel and some high-quality provincial-level video channels, including a central set, three sets, five sets, six sets, and eight sets of central programs. In keeping with the same, Hunan Satellite TV and Zhejiang Satellite TV, two provincial-level satellite TV stations, have been devoting themselves to creating high-quality TV dramas and explosive variety shows in recent years, and have become the most popular TV channels for cable digital TV, IPTV and OTT TV users. In addition, the gradual formation of the user's viewing habits for high-definition channels also makes the central high-definition channel, Hunan Satellite TV high-definition channel, etc. also become frequently replayed TV channels.
Table 5 TV channel TOP10 (%) that is played back regularly by cable TV digital TV, IPTV, and OTT TV users in 2017
Power Storage LiFePO4 Battery Solar Energy Systems For Home
|
S/N
|
Item
|
Content
|
|
1
|
product type
|
Modular 48V large-capacity energy storage power system
|
|
2
|
Module model
|
48V200Ah
|
|
3
|
Weight
|
430kg
|
|
4
|
System capacity
|
200Ah*Parallel number(200~2000Ah)
|
|
5
|
Module dimension
|
19-inch standard cabinet width, thickness 5U, depth 480
|
|
6
|
Maximum continuous charge and discharge current
|
0.75C
|
|
7
|
Installation method
|
Pedal models, seat bucket models, etc.
|
|
8
|
IP rating
|
Module IP20, system power box can be customized IP65
|
|
9
|
Service life
|
10 years or 3000 cycles
|
|
10
|
Operating temperature range
|
Temperature: -20~60℃ Humidity: ≤85%RH
|
|
11
|
product description
|
The product is positioned as an energy storage power supply system, in accordance with the ultra-long storage/cycle life, modular design, can be connected in parallel according to the required system capacity, and can realize battery intelligent monitoring and
battery management through RS485 communication or CAN communication, and inverter power supply/ UPS power supply and other equipment are perfectly compatible and can be widely used in various 48V energy storage power systems |
|
14
|
certificate
|
MSDS,ISO9001,CB,UN38.3
|
Energy Storage Lithium Battery Cbinet For Home
Jiangsu Zhitai New Energy Technology Co.,Ltd , https://www.jszhitaienergy.com