This article: SLAB memory allocator - SLUB's DEBUG function, how to help detect out-of-bounds (out-of-bounds) and access to the memory (use-after-free). This article directory:
1 Introduction
2. SLUB DEBUG function
3. object layout
4. SLUB DEBUG principle
5. slabinfo
1 Introduction
At work, you often encounter strange problems caused by cross-border. Why is the problem caused by cross-border access very strange? In the course of almost half a year of work, I encountered a lot of problems caused by cross-border access (have to vomit the drivers provided by IC manufacturers, always hiding bugs). For example, the crash caused by cross-border access, the emergence of such problems generally requires a long time to test, and even if there is a panic log. You have no clue. Why is this? Suppose that driver A applies for a piece of memory through kmalloc(), and does not pay attention to cross-border rewriting the data of the object adjacent to it. (After my previous SLUB article analysis, you should understand that kmalloc is implemented based on kmem_cache), assuming the object being rewritten. It is used by the B driver. The coincidence B driver uses the object to store the address data, if the B driver accesses this address. Then, the B drive is dead, panic is also a strange B drive. Imagine which driver is being used for this rewritten object. Isn't that driver unlucky? And every time the crashed log panic is most likely to happen in different modules. But the real culprit is the A drive. He is fine. You still don't know. Is it terrible? It’s simply killing people with a knife!
Of course, cross-border access does not necessarily crash. I had a very strange problem before. There are two global array variables (used as storage strings) that are used by modules C and D, respectively. These two arrays are the name information that the upper layer needs to display. When both the C and D modules work, it is found that the name of the C module is incorrect, but the name of the D module is normal. Remove the D module and find that the name of the C module is displayed correctly. At that time, I looked at the System.map file and found that the memory allocated by the two global array variables is together, due to the D-module out-of-bounds write. And this situation will not crash. But when you encounter this situation, you are surprised, how can this be? It doesn't matter between the two modules! It is quite time consuming to find a problem without using a detection tool at all. And there may be no clue.
How do we position this kind of problem? So we encountered a debug method that can detect out-of-bounds (oob) problems. In the first case just now, SLUB can bring its own debug function. For the second case, you need to use the more powerful KASAN tool (there will be an article later).
Therefore, we need a means of debugging to help us locate the problem. SLUB DEBUG is one of them. But SLUB DEBUG only targets the memory allocated from the slub allocator. If you need to detect the problem of allocating memory from the stack or the data area, it will not work. Of course, you can choose KASAN. This article focuses on the principles of SLUB DEBUG and how to locate these problems.
SLUB DEBUG detects the principle of oob problem is also very simple, in order to find out whether it is out of bounds, then add an extra memory at the end of the allocated memory, fill the special number (magic num). We only need to check if the data of this extra memory has been modified to know if the oob situation has occurred. And this extra memory is called Redzone. The literal translation of the "red area" is not a sense of sacred inviolability.
Description: slab was the first to join linux, only slab existed at that time. With the emergence of slub over time, slub is an improvement based on slab and performs well on the mainframe. The slob is designed for small systems. Since the interface implemented by slub is consistent with the slab interface (although you use the slub allocator, many function names and data structures are still consistent with slab), so sometimes slab is used to refer to slab, slub and slob. Slab, slub and slob are just different in allocating memory policies. The management ideas are basically the same. This article is about the principle of the slub allocator debug. But for the memory managed by the allocator, the following is collectively referred to as the slab cache pool. So in the article, slub and slab will be mixed, indicating the same meaning.
Note: The article code analysis is based on linux-4.15.0-rc3.
2.SLUB DEBUG function
SLUB DEBUG can detect problems such as out-of-bounds and access-after-free.
1.1. How to open the function
Reconfigure the kernel option and open the following options.
CONFIG_SLUB=y
CONFIG_SLUB_DEBUG=y
CONFIG_SLUB_DEBUG_ON=y
1.2. How to use
If the bug in the program wants to use SLUB DEBUG to detect it, you need the slabinfo command. Because the SLUB memory detection function cannot be detected immediately in some cases, it must be triggered actively, so we need to trigger the SLUB allocator detection function with the slabinfo command. Compared with KASAN, this is also a disadvantage of SLUB DEBUG. After all, KASAN can report problems when cross-border issues arise.
The slabinfo tool source is located in the tools/vm directory. You can compile the slabinfo tool (for ARM64 architecture) with the following command.
Aarch64-linux-gnu-gcc -o slabinfo slabinfo.c
When the system is powered on, you can run the slaninfo –v command to trigger the SLUB allocator to detect all objects and output log information to syslog. The next task is to check if the log information contains the bug log output by SLUB allocator. In fact, some bugs can be captured without running the slabinfo command, but some must use the slabinfo -v command. The next section will introduce the principles of SLUB DEBUG, to uncover which bugs you need without the slabinfo command.
3. object layout
After configuring the kernel option CONFIG_SLUB_DEBUG_ON, a lot of flags (SLAB_CONSISTENCY_CHECKS, SLAB_RED_ZONE, SLAB_POISON, SLAB_STORE_USER) are passed when creating kmem_cache. For these flags, the format of the object object managed by the SLUB allocator will change. As shown below.

In the case of SLUB DEBUG closed, the free pointer is embedded in the object, but after SLUB DEBUG is opened, the free pointer is outside the object, and a lot of other memory, such as red zone, trace and red_left_pad. The reason why the FP is moved back is because in order to detect the use-after-free problem, the object will be filled with magic num (0x6b) when the object is free. If you do not move backwards, it does not destroy the single-link table relationship between objects.
3.1. What is the use of Red zone?
From the figure we can see that the red zone is followed by the object, so what is the role of the Red zone? Since it is followed, it is natural to detect the right out-of-bounds access. The principle is very simple. Fill the magic num in the Red zone area and check if the Red zone area data is modified to know if the right oob occurs.
Maybe you will think that if you cross Redzone and directly rewrite FP, you can't detect oob, and the linked list structure is also destroyed. In fact, in the check_object () function will call check_valid_pointer () to check whether the FP is valid, if invalid, the same will print error syslog.
3.2. What is the use of padding?
Padding is the padding area of ​​sizeof(void *) bytes. When allocating the slab buffer pool, it will fill all memory with 0x5a. Also in the free/alloc object as a way to detect. If the data in the padding area is not 0x5a, it means that the "Object padding overwritten" problem has occurred. It is also possible that the transboundary span is large.
3.3. What is the use of red_left_pad?
Red_left_pad and Red zone have the same effect. All are to detect oob. The difference is that Red zone detects right oob, and red_left_pad detects left oob. If you just see the object layout in the picture above. You may be curious, if left oob occurs, then the red_left_pad area of ​​the previous object should be overwritten instead of the current object's red_left_pad. If you notice this problem, it is still very clever, and this has been discovered by you. To avoid this, the SLUB allocator does a conversion when initializing the slab cache pool.
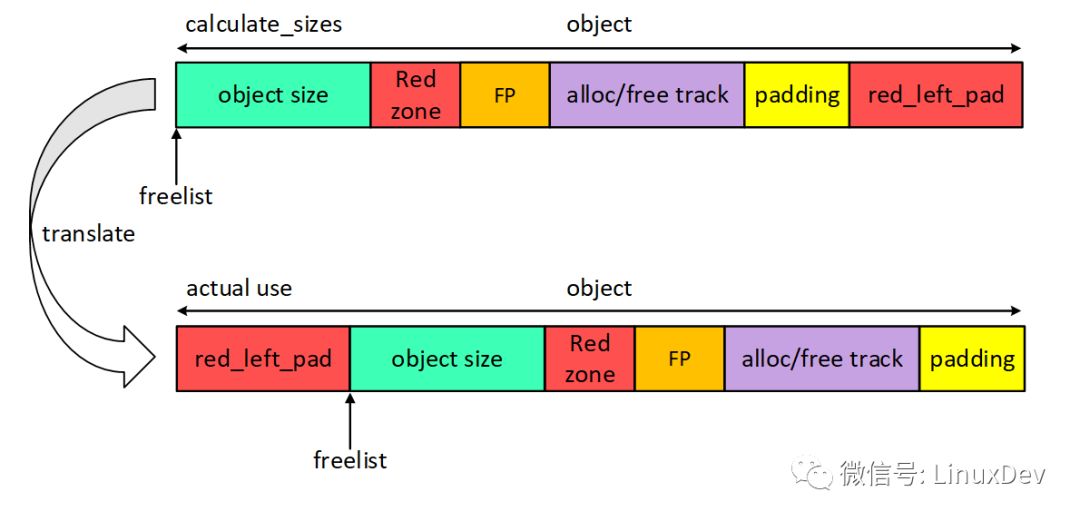
If you are going to track kmem_cache_create(), lay out the object in calculate_sizes(). The layout of the area is as if you saw the top half of the picture above. When I first saw this code, I thought so. In fact, this is not the case. There is a freelist pointer in the struct page structure, and the freelist will point to the first available object. When constructing a single-linked list between objects, the first address of the object will actually be offset by a red_left_pad, so that the actual layout is like the layout after the conversion in the image. Why is this so? Because the left oob function is not detected when there is a SLUB DEBUG function. This conversion is a modification of the subsequent patch. The patch is to increase the left oob detection function.
After the conversion, red_left_pad can detect leftoob. The detection method is the same as the Red zone area, and the filled magic num is the same. The difference is that the detected area is different.
4. SLUB DEBUG principle
After the analysis in the previous section, the general principle should be clear. From the high level, SLUB is to fill a special magic num with a special area, and check whether the magic num is accidentally modified every time alloc/free.
4.1. magic num
What are the magic num in SLUB? All the magic num macros used are defined in the include/linux/poison.h file.

SLUB_RED_INACTIVE and SLUB_RED_ACTIVE are used to populate the Red zone and red_left_pad in order to detect oob. POISON_INUSE is used to fill the padding area. It can also be used to detect oob, just poison overwrite. The POISON_FREE function is to detect the use-after-free problem. POISON_END is the last byte of the available area of ​​the object.
4.2. slab cache pool fill
When the SLUB allocator applies for a block of memory as the slab cache pool, the entire block of memory is filled with POISON_INUSE. As shown below.
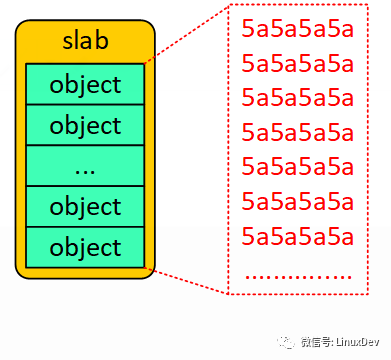
Then the relevant area is filled into the free object by the init_object() function, and a singly linked list is created. Note that the location pointed to by the freelist pointer is not the same as SLUB_DEBUG on and off. Mainly the conversion relationship mentioned in Section 3.3. Why is this filled up as a freeobject? In fact, it is just to pretend that I am free object here, it is also reasonable. The object initialization process is as follows.

4.3. free objectlayout
After the slab buffer pool and the free object have been allocated, the system will initialize the various fields of the object by calling the init_object() function, mainly filling the magic num. The free object layout is shown below.

Red_left_pad and Red zone are populated with SLUB_RED_INACTIVE(0xbb);
Object is populated with POISON_FREE(0x6b), but the last byte is filled with POISON_END(0xa5);
Padding is already populated with POISON_INUSE(0x5a) when allocate_slab. If the program changes unexpectedly, when it detects that padding is changed, it will output error syslog and continue to fill 0x5a.
4.4. alloc object layout
When an object is requested from the SLUB allocator, the system also calls init_object() to initialize it to the desired appearance. The alloc object layout is shown below.

Red_left_pad and Red zone are populated with SLUB_RED_ACTIVE(0xcc);
Object is populated with POISON_FREE(0x6b), but the last byte is filled with POISON_END(0xa5);
Padding is already populated with POISON_INUSE(0x5a) when allocate_slab. If the program changes unexpectedly, when it detects that padding is changed, it will output error syslog and continue to fill 0x5a.
Compared with the free object layout, the alloc object layout is only the difference between red_left_pad and Red zone. Now that the padding data is fixed, here's how to check for oob, use-after-free, and more.
4.5. out-of-bounds bugs detect
The following demo routine is used to illustrate oob detection. We use kmalloc to allocate 32 bytes of memory, and then create an out-of-bounds access to the 33rd element, which is bound to be out of bounds. Since kmalloc is based on SLUB allocator, this bug can be detected.
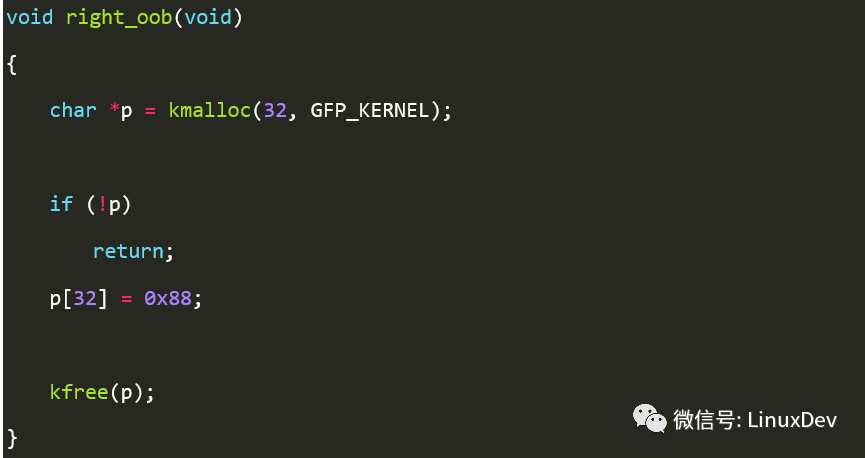
The object layout after running is shown below.

We can see that the Red zone area should have been modified to 0x88. Obviously this is a Redzone overwritten issue. So when will the system detect this serious bug? Just after you kfree(). In kfree(), it will detect whether the value of each area in the released object is valid. The value of the Redzone area is 0xcc or valid, so it will detect that 0x88 is not 0xcc, and then output errorsyslog. Kfree() will eventually call free_consistency_checks() to detect the object. The free_consistency_checks() function is as follows.
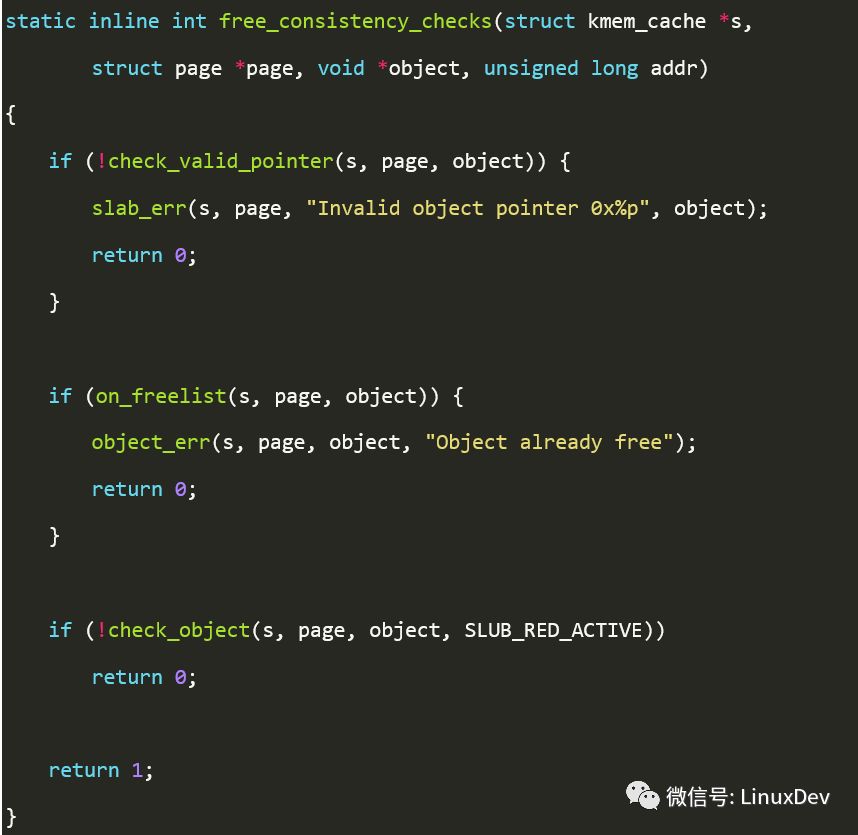
Check_valid_pointer() is responsible for detecting whether the object's free pointer pointer data is valid. Oob is likely to cause this to happen.
On_freelist() detects if the object is free and can detect multiple free bugs.
Check_object() will check if the value of the Red zone area has been changed, so a bug will be reported here.
If it is the left border crossing visit, can it be detected as well? You can test the following demo routines.
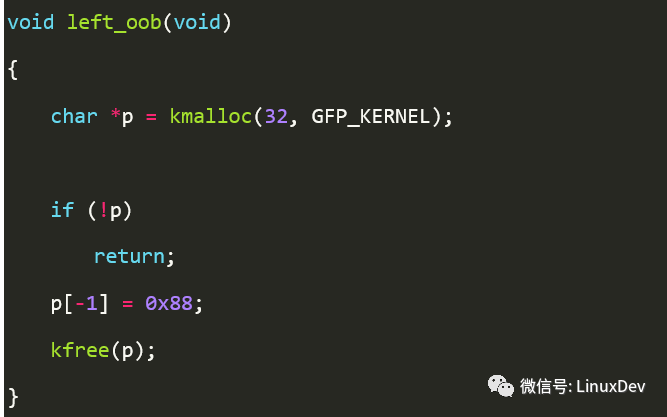
The object layout after running is shown below.
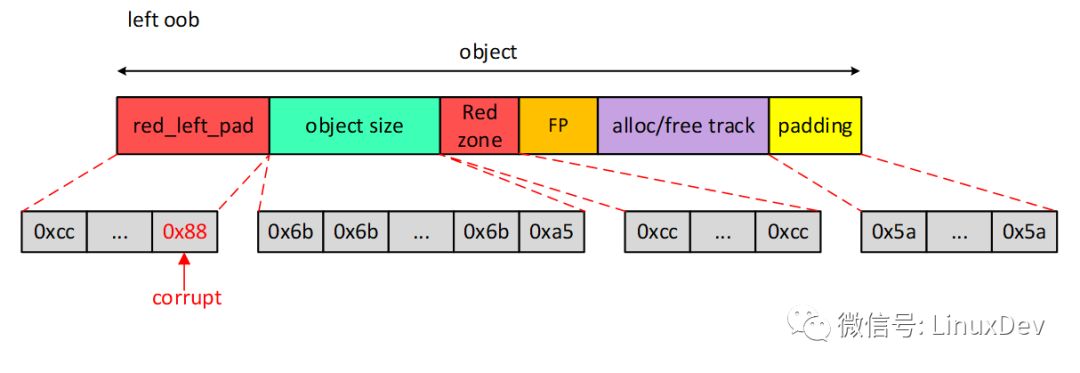
The detection method is similar, and here is the final left oob problem detected by detecting the red_left_pad area in the free_consistency_checks() function.
Maybe you will think that if I only apply for memory and don't release it, can this bug be detected? In fact, this is not possible. We can only actively trigger the detection function with the help of the slabinfo tool. Therefore, this is also a disadvantage of SLUB DEBUG, it can not be dynamically monitored. Its detection mechanism is passive.
4.6. use-after-free bugs detect
If it is a use-after-free question, how do we detect it? First on the demo routine.
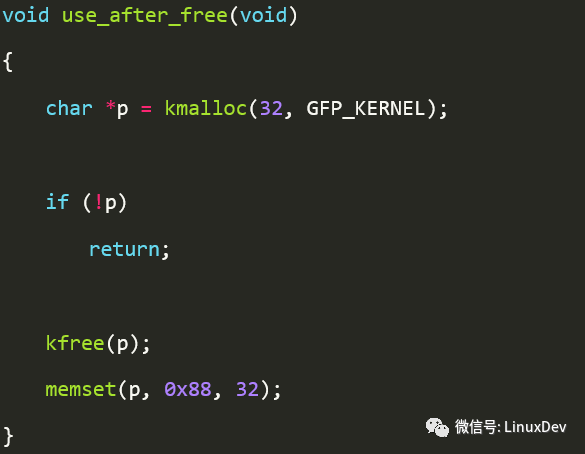
After the operation, the object layout is as shown below.

Remember what was said above? SLUB DEBUG is passive. So here you have to choose the slabinfo tool. The command interrupt can be input to slabinfo –v. The principle of slabinfo detection is also very simple, convenient for all objects that have been released, check whether the object area is all 0x6b (the last byte oxa5), if not, it is naturally use-after-free.
5. slabinfo
Let's take a look at the implementation of the slabinfo –v command and the process of checking it. The slabinfo source is located in the tools/vm/slabinfo.c file. The slabinfo –v command execution flow is shown in the figure below.

The set_obj() function is executed for each slab in the system. The set_obj() code is as follows:
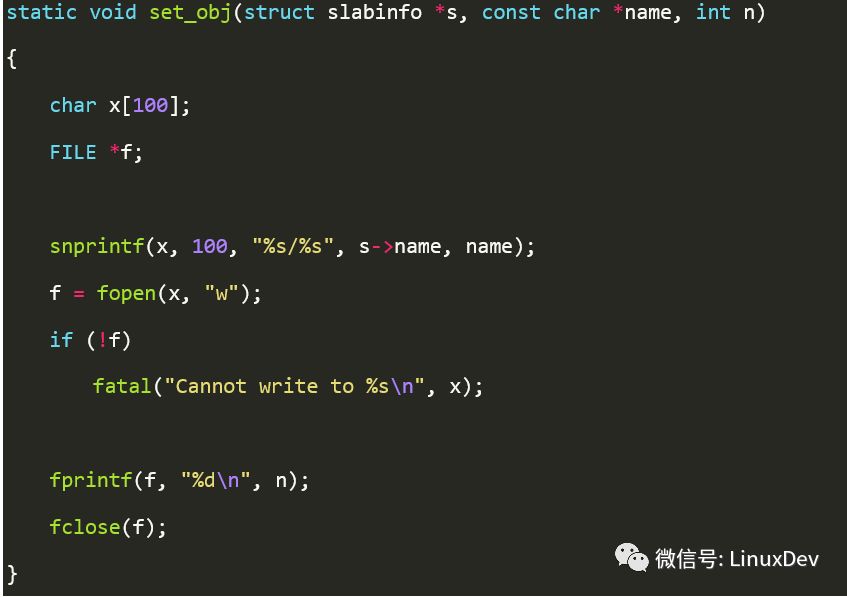
The set_obj() parameter name is passed "validate", and n is passed 1. The role is to /sys/kernel/slab/

The validate_slab() code is as follows:
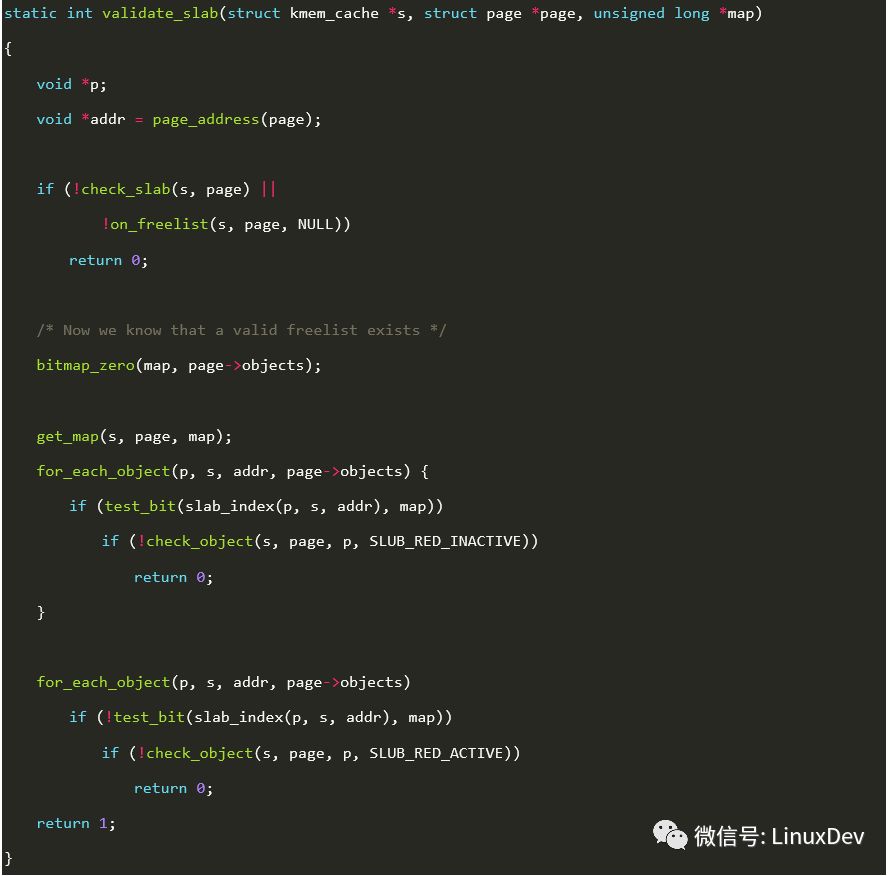
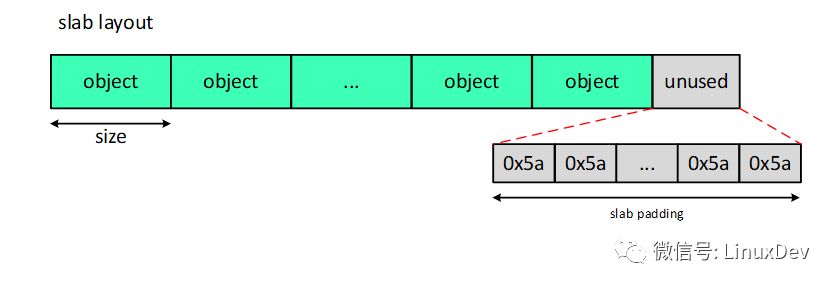
Check_slab() will call slab_pad_check() to check the slab padding area. Slab padding and padding in object are not the same thing. If the page allocated from the buddy system is divided into many objects according to the SLUB rule, then it may not be divisible, then the remaining unused area is slab padding. The value of valid is 0x5a. As shown below.
Get_map() uses a bitmap to mark all available objects. For example, the slab cache pool has a total of 10 objects, sorted by the address size 0-9 (equivalent to index). Assume that objects 5 and 8 have been assigned. Then in addition to bit5 and bit8 in the bitmap, the remaining bits are 1.
The first for loop traverses all available objects for problems such as oob, use-after-free, and object padding overwritten.
The second for loop traverses all objects that have been allocated for an oob problem.
Nantong Boxin Electronic Technology Co., Ltd. , https://www.ntbosen.com